I was pretty tired of waiting to activate my debug pointer in PHPStorm editor while I was debugging the code. I was out of a clue at that time. Why is this taking this much time to come to the breakpoint line of the code? Have you ever experience this situation?
You are in the right place to know how we can mitigate it. The root cause was it would create a list of pointers in the PHPStorm when we add the debug breakpoints in the code. Then once we enable the debug and execute the code, it will go through all of those pointers, and if there are a list of breakpoints it will take ages to come to your debug location.
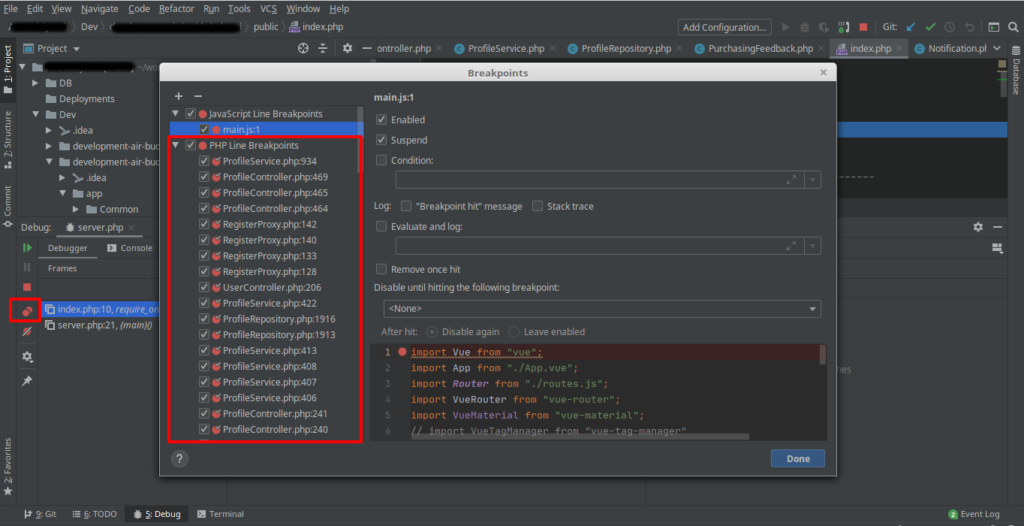
The simple solution to prevent this situation is to remove if you have any unnecessary break pointers from the list. You can speed up the debug process in PHP Strom if you have a fewer breakpoints list. You can easily find all the available PHP breakpoints as below once you enable the debugger in the IDE.

Try it out, and let me know how it goes! I hope this will help you to speed up your coding.
Happy coding! cheers…